Shading
To perform an accurate building energy analysis is important the correct evaluation of thermal contributions of direct solar heat gain on the transparent and opaque building envelope surface during a whole year.
The amount of the sun’s energy reaching the surface of the buildings is a function of the local climate, topography of the place, tilt of the surfaces, physical characteristics.
In new construction or redevelopment design is important assess the impact of physical obstructions affect the access to direct solar radiation in the future as well as the present (a building may be erected on adjacent site or exixting building replaced by a larger one …). When assessing radiation reaching the surface, is essential to consider three types of it:
- direct radiation (sometimes called beam radiation) part of the radiation that reaches the ground with a single incident angle without any reflections or absorptions;
- diffuse radiation represents that part of the radiation has been by molecules and particles in the atmosphere to all directions and reaches the ground at different angles;
- radiation reflected or albedo, is part of direct and diffuse radiation reflected from the ground or other surfaces surrounding.
The sunshine and shading conditions may be determined through the sun path diagrams that calculate the solar azimuth and altitude for any time of the day and day of the year.
Stereographic sun path diagrams
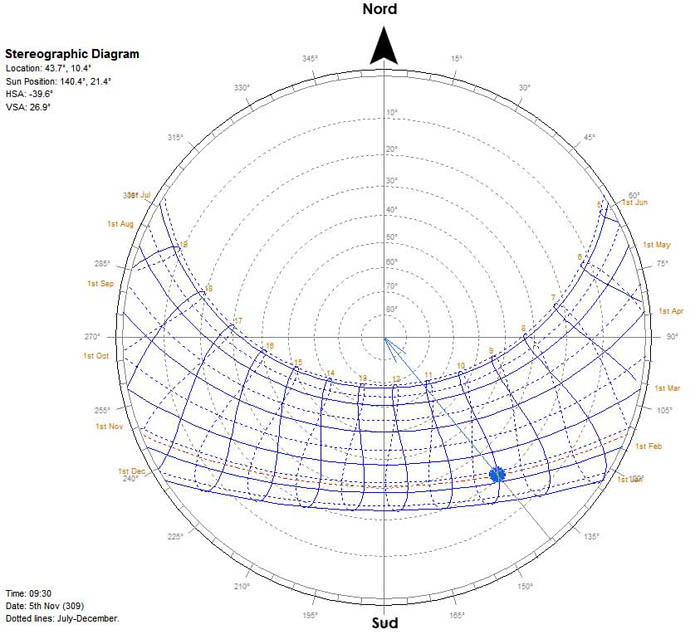
Represents a polar projection of the sky, comparable to a photograph of the sky taken whilst lying on your back looking straight up towards the zenith with a 180°. The solar path in the sky is defined by the altitude and azimuth for any time of the day and day of the year. The concentric circle lines represent altitude angles run from the centre of the diagram out in 10 ° increments from 90 to 0. The edge of the diagram instead represent azimuth angles in reference to the north. Curved lines run from the east to west show the winter sun rises in the southeast peaks out at a low angle above the southern horizon, and then sets in the southwest (Northern Hemisphere). For places in the northern hemisphere, the shortest solar day occurs around December 21(winter solstice) and the longest solar day occurs around June 21 (summer solstice). The primary advantage of this method is that it increases the resolution of the diagram at low solar altitudes making it more suitable for the majority of surrounding building overshadowing situations.
In the figure is shown the position of the sun with 21° altitude and 140° azimuth on 5 November at 9:30 am for the city of Pisa.
Orthographic sun path diagrams
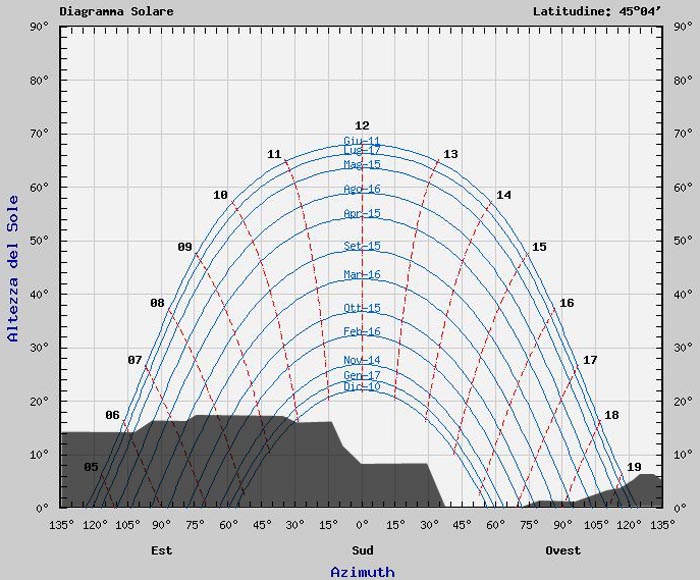
A cylindrical projection is simply a 2D graph of the sun position in Cartesian coordinates. The azimuth is plotted along the horizontal axis whilst the altitude is plotted vertically. This refers to a straight mapping of azimuth and altitude angles onto the X and Y axis (respectively) of a cartesian graph. The key to an orthographic projection is that, much like plan view or elevation of a 3D object. On surface differently oriented overshadowing by overhangs, obstructions, existing buildings, mountains can be determined knowing two parameters in the diagram.
The sun angle varies throughout the year: in the northern hemisphere sun rises in the south-east and sets in the southwest, while in summer it rises in the north-east and sets in the north-west. So sun angle is much higher in summer (about 65°) than in winter (about 20°). This means that the sun's rays strike the ground more directly in summer. In winter the same amount of energy is diluted over a larger area of ground.
For buildings with high energy performance, such as Passivhaus standard built, the elaboration of the diagram positions solar is an important tool for solar gains analysis pass through glazed openings. The aim is to maximize building thermal balance that means maximise solar heat gains in winter and minimize unwelcome solar heat gains in summer. Through the solar diagram will be determined the best location on the sun and evaluate appropriate strategies to improve performance.
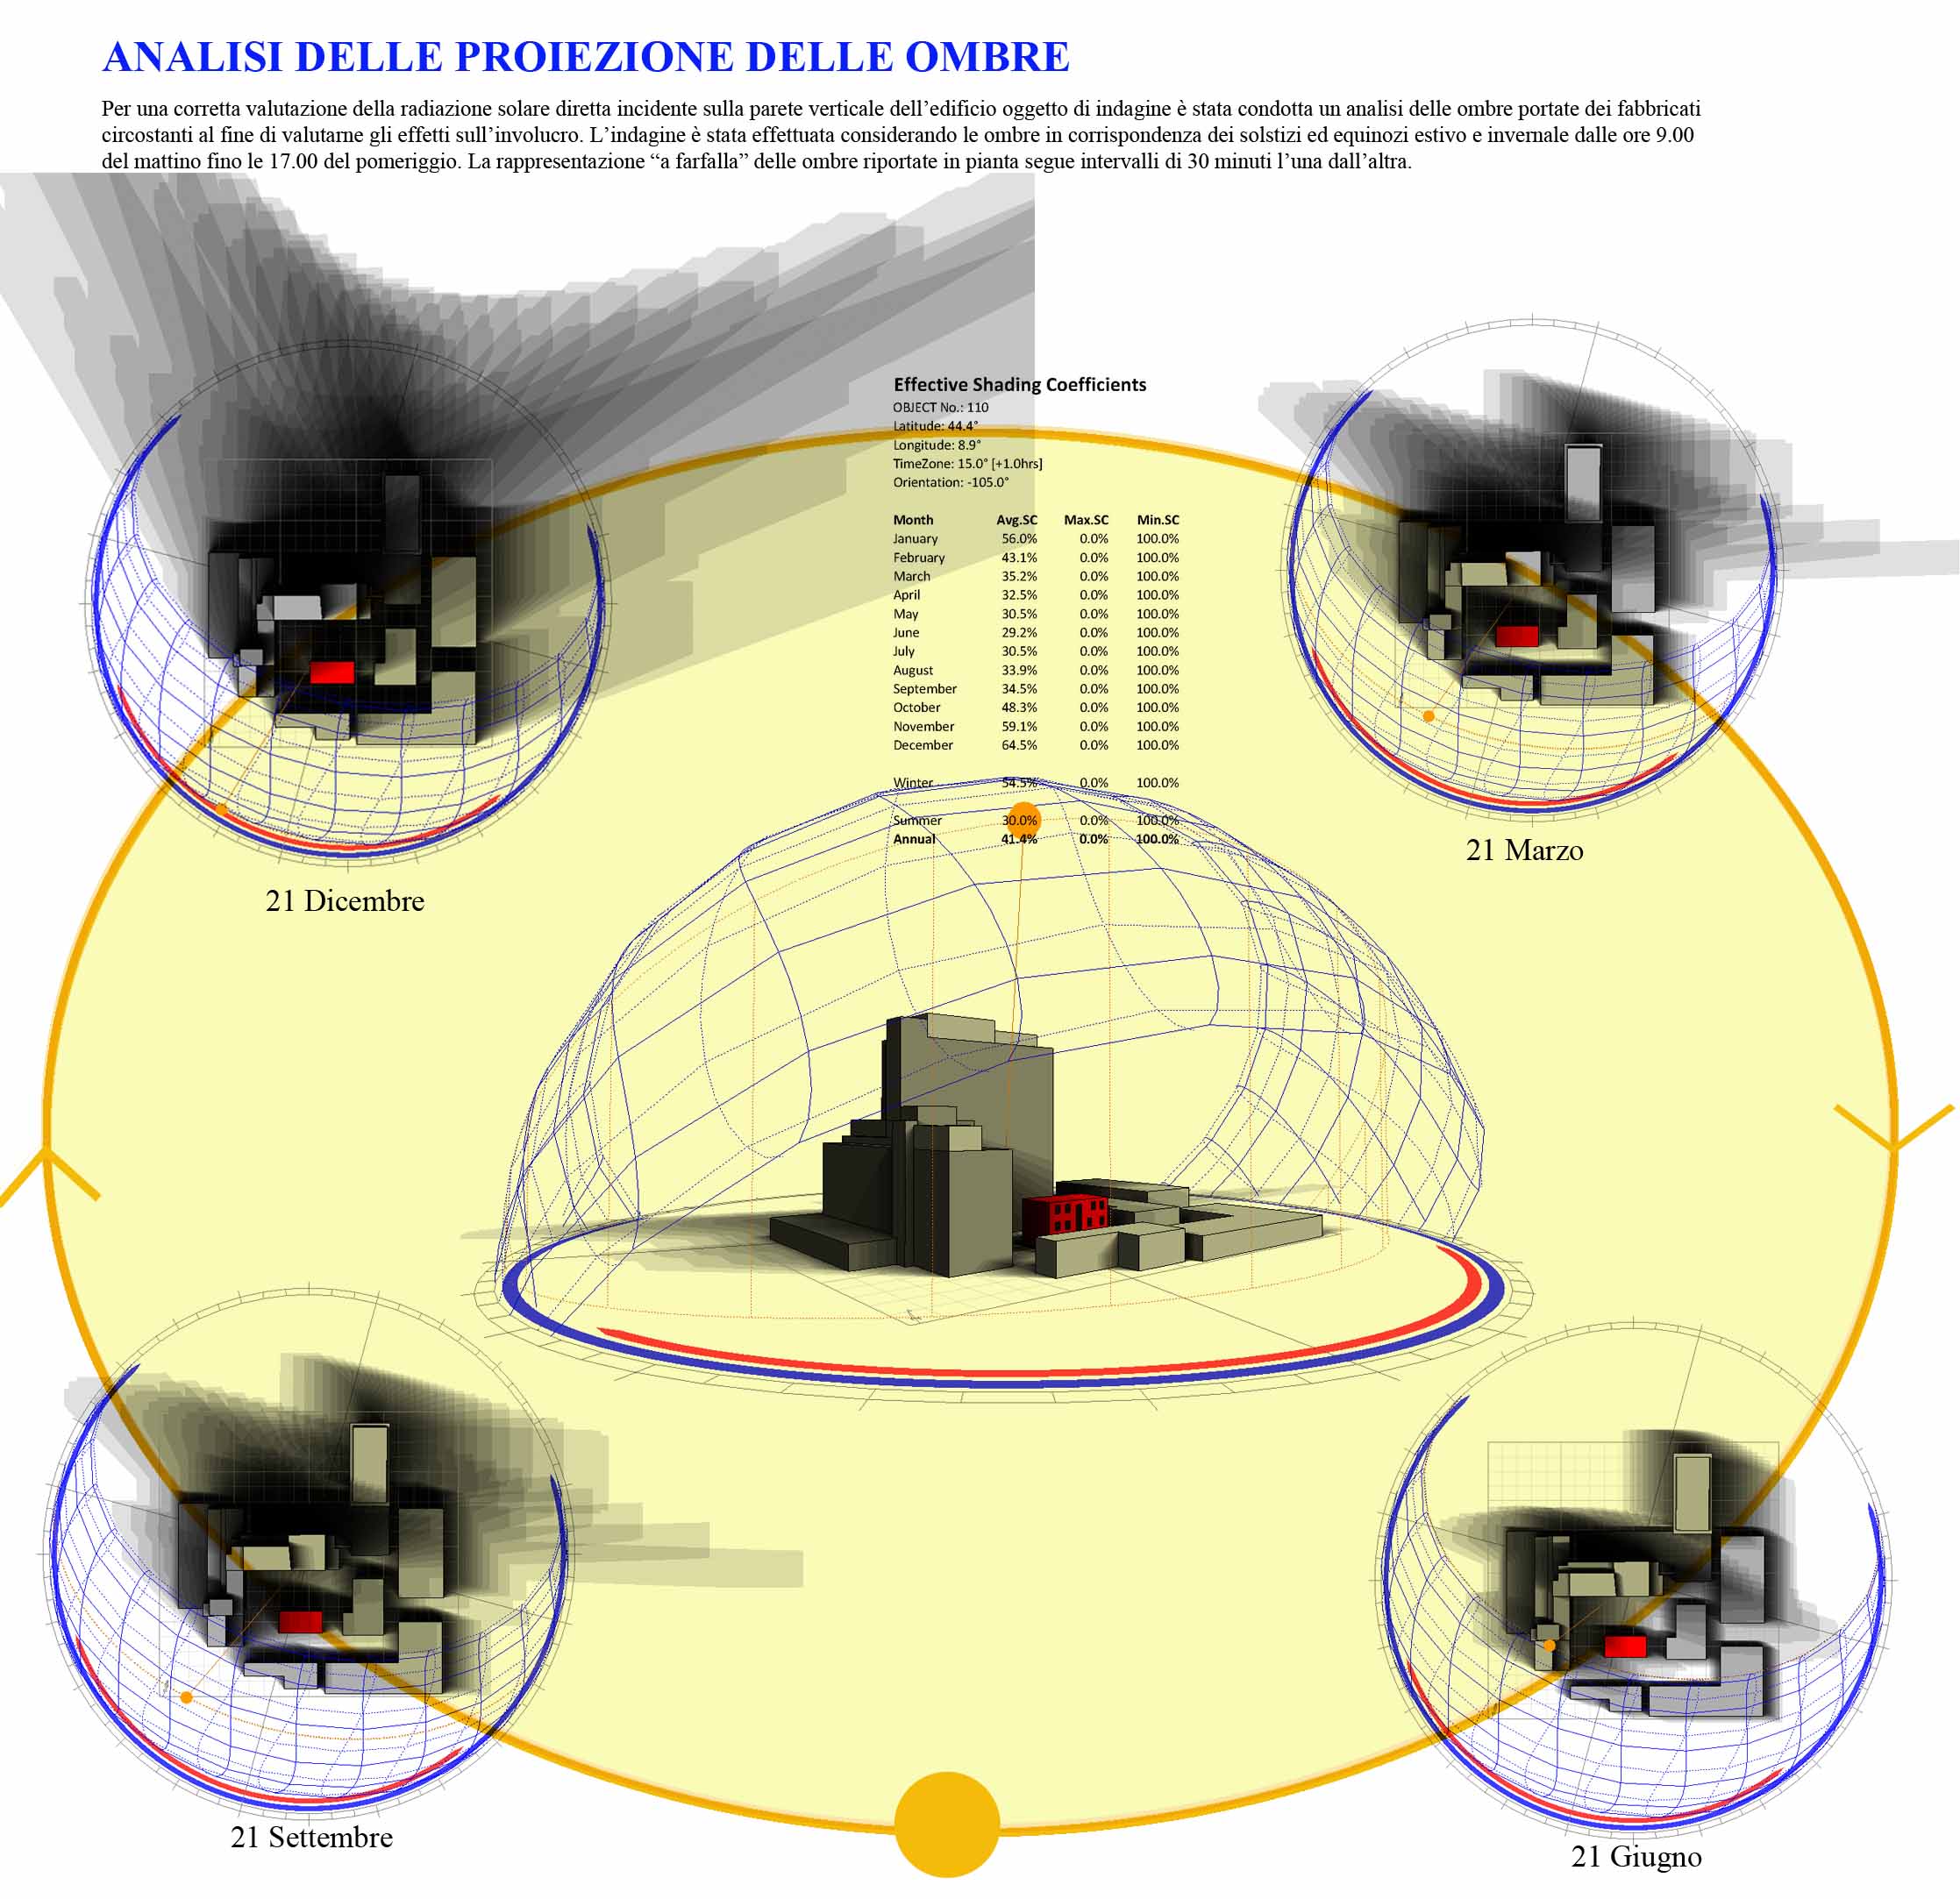
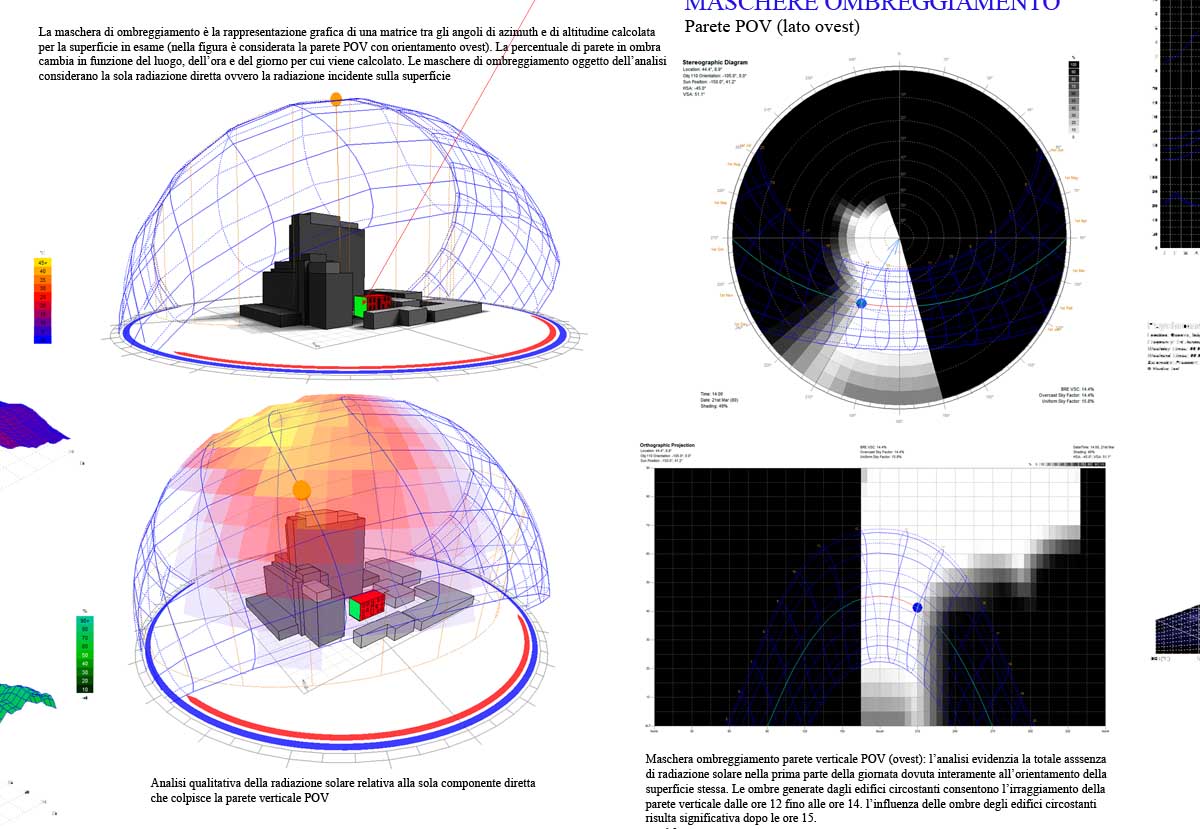
For each transparent or opaque building surface’s it is possible to create sun path charts to evaluate the influence of the shadows generated by external obstructions. In the following figures show some images of a study conducted for a building renovation.
For the assessment of the energy balance and the solar gains of the building an analysis was made of shading which allowed to highlight the critical intervention and at the same time made it possible to determine the appropriate strategies to improving indoor levels comfort of the user (visual, acoustic) associated with the reduction of energy requirements for summer. To prevent summer overheating of indoor spaces, especially in the early afternoon (wall facing west) has been proposed the solution of external shielding designed to block solar radiation in those particular hours allowing to reach the best compromise of the heat balance summer-winter.